Recall that when we were drawing the contour lines, that I mentioned that we should keep the Digital Elevation Model (DEM) files around. Now we'll be returning to them, and getting shaded relief for them.
To do that, we create the shading layers for individual quadrangles. (While this process is running, you probably want to uncheck 'Render' in the status bar; updating the screen with the results is expensive.)
Select ‘Raster->Analysis->DEM (Terrain Models)’ from the ‘Raster’ menu.

(1) In the ‘Input File,’ browse to a DEM file for a quadrangle that you saved from the earlier step. In the ‘Output File,’ enter (or browse to) the path of a new TIFF file that will hold the relief shading.
(2) Select ‘Hillshade’ under ‘Mode.’ You can leave all the other options at their default settings.
(3) Select ‘Load into canvas when finished,’ and select ‘OK’
Repeat the process for any other quadrangles that you need to process, then select ‘Close’ to dismiss the dialog.
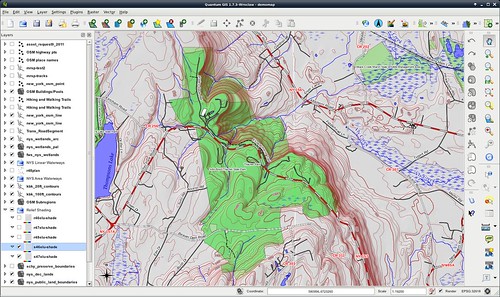
Now drag the new layers in the left-hand column of the screen to a position below the 'subregions' layer but above the 'land use' and 'public lands' layers.
Right-click each of the new layers, and pull ‘Properties’ from the context menu.
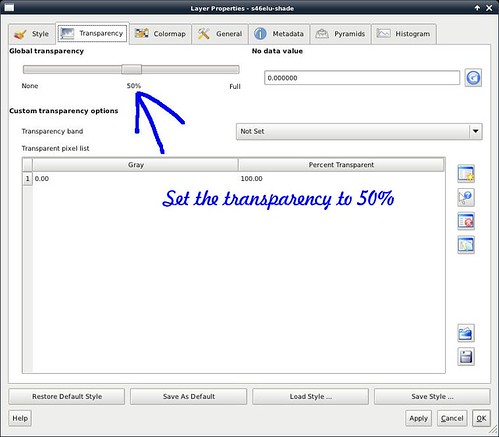
Go to the ‘Transparency’ tab, and change ‘Global Transparency’ to 50%.
Turn 'Render' back on in the status bar, and admire your shaded-relief map.
Next installment: Adding some point features.
No comments:
Post a Comment